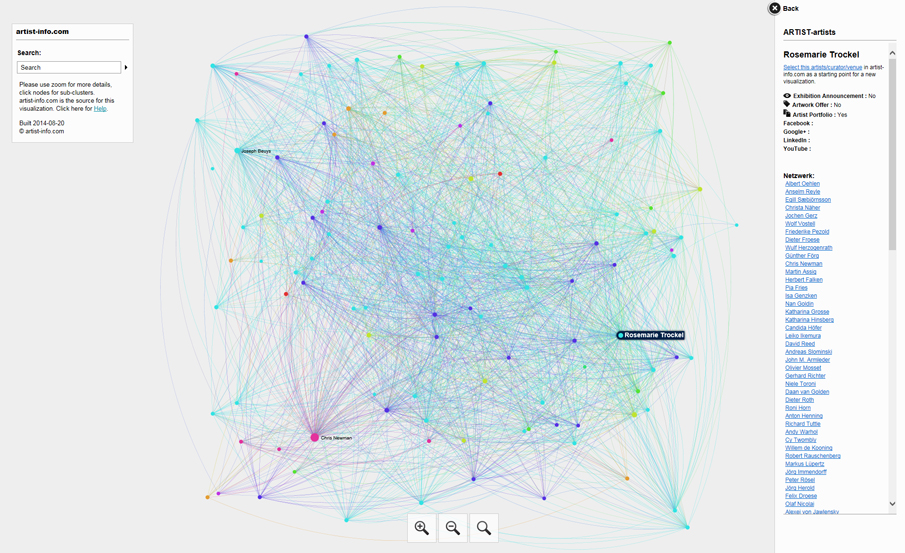
Detail of the ARTIST-artists network. To open the complete view in a new browser window click here.
Visalizing Art Networks
How are artists and exhibition places and curators connected among each other?
The world of contemporary fine art might have many random aspects, but on an upper level the bits and pieces summarize to network structures and clusters.
It is the first time ever a network graph is used to analyse and describe the world of contemporary art with artists, curators, and exhibition places.
The exhibition history is for all, the artist with a biography on solo- und group-exhibitions, the exhibition venue with its program, and the curator an important source for their profile and positioning, their mission and quality. And although their individual branding is existential to them they are all building upon each other’s efforts in some way.
However, retracing geographically and chronologically the exhibition information using a network graph wouldn’t reveal much new insight.
Using Big Data and cross-linking and analyzing all exhibition histories from 1930 up to today on the basis of ‘nomen est omen’ artist-info.com is offering new insight on a meta level.
Visualizing Art Neworks by artist-info is identifying, helping to explore and to develop the valuable connections between artists, curators and exhibition places.
The Visualization identifies, helps to explore, and to develop the valuable connections among the participating artists, curators and exhibition places.
Using Network Graphs
The human eye is able to explore and interpret visual sources like a network graph in much greater depth than it would be possible with lists and tables. Transforming scientific
Social Network Analysis (SNA) with network graphs is used to show with nodes and etches the relations of network members, based on their attributes.
It is our starting point for visualizing the world of contemporary art.
Finding a Reliable Source
Although there might be a number of different levels on which artists, curators, exhibition places meet, and other institutions and individuals involved in contemporary art exchange their views and develop their contacts, there is one stable and reliable level, which mirrors these networks.
It is the wide scope of exhibitions of an artist and the wide scope of the many different exhibition places showing artists in a known or new context, following a vision and a new point of view to question a specific status.
Cross-linking all exhibition information enables us to understand the world of contemporary art with the artists, curators and exhibition places as many networks besides one another. The reason the members of these networks were connected among each other are their individual vision, and their concept, to show the artist’s work under known or new conditions.
Filling the Gap
Although the printed biography of an artist provides basic information, it almost never tells, who else was shown in a group exhibition, to be able to see the scope of concept and idea which lead to this exhibition. Listing the exhibition places where an artist did show his work always leads to the question, what makes this venue important for the artist? artist-info.com exhibition histories provide this missing information on the basis of reliable research.
For us artist-info.com exhibition history details are an elementary source for insights and to compare different visions, concepts, approaches and attitudes among the many possibilities to look at the position of artists and their work and exhibition places in the world of contemporary art.
 Visualizing Art Networks
Visualizing Art Networks provides for a specific artist, curator, or exhibition place (gallery, museum, non-profit place, or collector) as the CENTRAL node the following points of view for visualizing their network, showing how the members of the network are connected with the CENTRAL node and among each other.
Open these interactive examples in a new browser window
 ARTIST ⇔ artists
ARTIST ⇔ exhibition places
The two views available for an artist are showing how all artists are connected through exhibitions, and how the venues are connected through artists.
CURATOR ⇔ artists
The view for a specific curator shows this curator, the exhibited artists and their connections among each other through exhibitions.
EXHIBITION PLACE ⇔ artists
EXHIBITION PLACE ⇔ exhibition places
The two views for an exhibition place show how artists are connected among each other, and how the specific venue is connected through artists with other exhibition places.
– Individual Browser Window
Network Visualization is available through an individual sub-URL to be displayed in its own browser tab or window.
To be able to explore the network graph with all its details, the user can zoom in with buttons at the bottom of the browser window. Zooming in will show the node’s names.
Each node can be clicked to filter its relations in connection with central node.
– Side Panes
Each individual selection of a cluster can be searched for member’s names with the search window at left. In the right side pane more details of network members are shown.
These are all members of the selected subset, including a link to the individual artist-info.com page, and some more details like available Exhibition Announcements or Artwork Offers, and community page links like Facebook, Google+, LinkedIn, or YouTube. Underneath are listed all members of the displayed network graph.
– Layout Characteristics
The network graph’s layout elements like color, the distance between nodes, or diameter of nodes is used to interpret specific attributes related to a node. These are for example the number of con-nections to other nodes, the number of exhibitions together with the central node to which the whole network graph is related.
– Propagations / Recommendations
Furthermore, the visualized results of our queries include propagations / recommendations for possible new connections.
These nodes are not directly connected with the central node but with a member. They are based on the statistic evaluation of highest number of exhibitions together with the specific member and are shown as ‘outsider’ nodes with a single line near the edge of the displayed visualization.
Explore and Discover with Visualization New Sides of Contemporary Art
artist-info network visualization identifies, helps to explore, and to develop the valuable connections among the participating artists, curators and exhibition places.
artist-info.com Artist example page
artist-info.com Curator example page
artist-info.com Exhibition Place example page
There is a wide range of possibilities for using our network visualization.
As it opens in a separate browser window the link can be used on any other website as part of your artist project, of promoting exhibitions giving exciting interactive insight, adding it to a web or print article on an artist, curator or exhibition place.
Last but not least: Include it on the artist’s, curator’s or exhibition place’s artist-info.com page, like on our example pages.
As an additional service your branding can be included in the left side pane of the visualization page.
Contact us
for visualizing the artist, curator or exhibition place of your choice.
Find out more about our services for contemporary art worldwide
Exhibition History – Exhibition Announcements – Artist-Portfolios – Artwork Offers – Newsletter Service – Network Visualization.
Go to visualizingartnetworks.com for more details and get startet.